
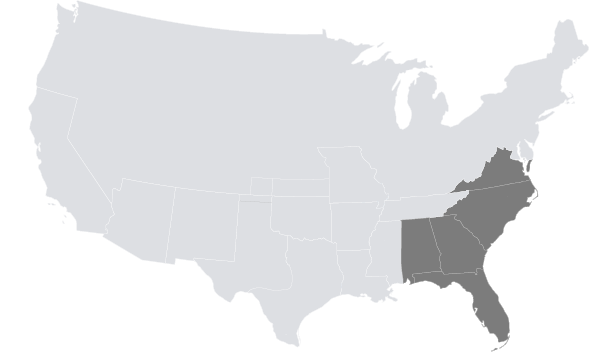
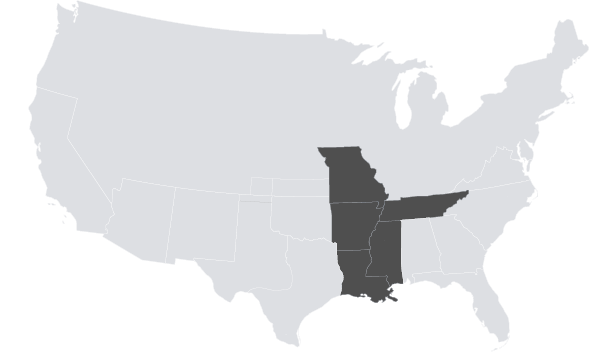
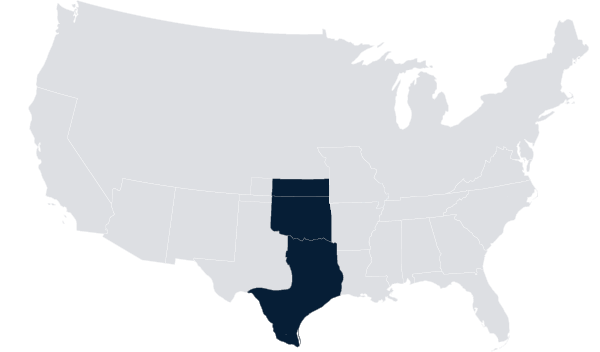
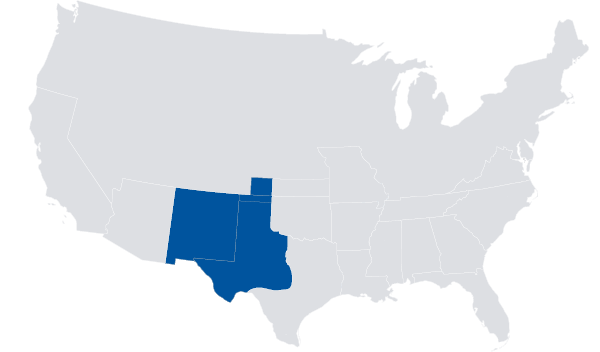
Click the map below to visit your regional page.

Please enter a valid location
BRED TO DELIVER UNRIVALED YIELD RESULTS
Get high yield potential across diverse acres.
Use local cotton yield results to help compare performance by region. You’ll find that PhytoGen® cottonseed is proving itself locally with breakthrough performances across all acres — in both challenging and prime fields. Official variety trials (OVTs), field trials, and real on-farm results across the Cotton Belt help growers like you understand how each of the PhytoGen® brand varieties perform.
When comparing cotton varieties, growers rely on local yield results to guide their decisions. Across diverse soils and growing conditions, data shows PhytoGen brand varieties consistently finish at or near the top in yield potential — helping protect profitability and strengthen ROI — when compared to DeltaPine®, FiberMax®, or Stoneville® cotton. Those who have switched to PhytoGen report higher yield potential with PhytoGen brand varieties — especially in fields challenged by nematodes, drought stress, or resistant weeds.
Check regional yield results below to see what PhytoGen has to deliver.
PhytoGen® brand PHY 357 W3FE won 63% of trials and delivered a 4.43% lint advantage against recently released Deltapine® cotton varieties.1 |
SELECT YOUR REGION
- SOUTHEAST
- MIDSOUTH
- SOUTH CENTRAL TEXAS
- SOUTHWEST PLAINS
- ARIZONA
- PIMA


1Data is based on average of 2025 comparisons from the 2025 and 2026 Deltapine advancement class varieties across 141 locations in the Cotton Belt as of 2/2/2026. 2Data is based on averages across 8 trial locations of the 2025 University of Georgia Official Variety Trials as of 2/5/2026. 3Data is based on averages across 6 trial locations of the 2025 LSU Official Variety Trials as of 2/5/2026. Comparisons are against any number of products of the indicated competitor brand unless otherwise stated. Product responses are variable and subject to any number of environmental, disease and pest pressures. Individual results may vary. Multi-year and multi-location data are a better predictor of future performance. DO NOT USE THIS OR ANY OTHER DATA FROM A LIMITED NUMBER OF TRIALS AS A SIGNIFICANT FACTOR IN PRODUCT SELECTION. Refer to www.phytogen.com or contact a PhytoGen field team member for the latest and complete listing of traits and scores for each PhytoGen® brand variety.